Metrics That Matter – Three Analyses for Startups and Scaleups to Track on the Path to Profitability

The rallying cry among the tech community in 2022 has been a shift from growth at any cost, to an increased emphasis on profitability. Our belief is that in turbulent times, startups and scaleups alike need to ensure:
- That they have balance sheets which provide sufficient runway to ride out a downturn without being fully reliant on large amounts of external funding
- That they are developing fundamentally healthy businesses with attractive underlying unit economics and a cost structure built for efficient growth
While every company is unique and it’s difficult to create a blueprint for must-track metrics across stages and business models (one should analyze a seed stage SaaS company differently than a growth stage gaming company, for example), we’ve found three metrics which provide helpful Green / Yellow / Red diagnostics for startups and scaleups alike amidst a deluge of potential metrics to track:
1] Cash Burn Efficiency

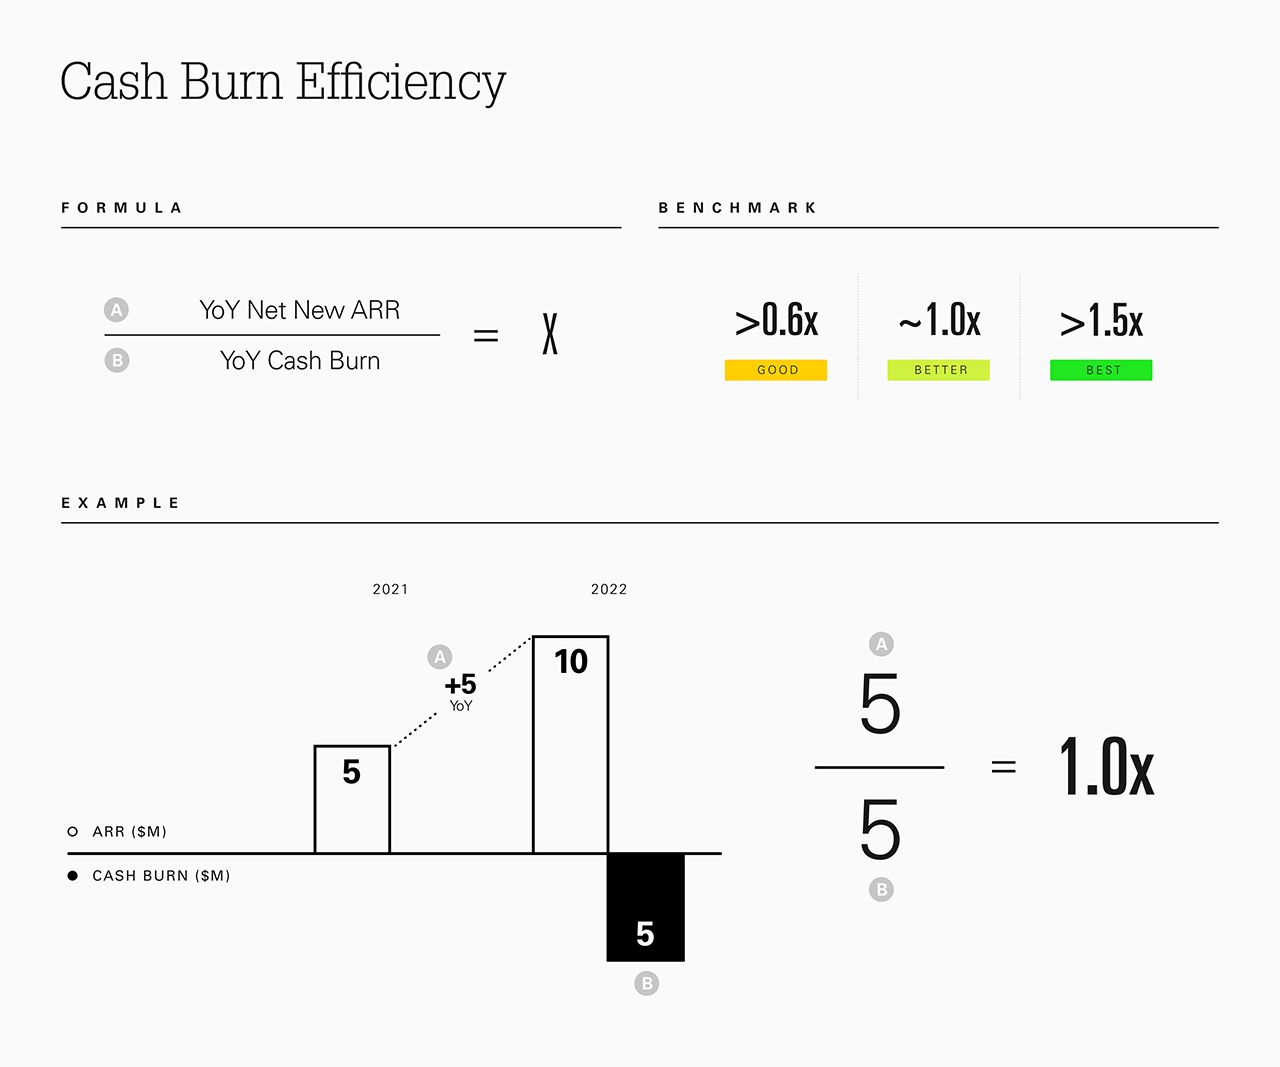
The majority of startups and scaleups are in cash burn mode – it requires meaningful investment to build and scale an organization, often before enough revenues are coming in to cover the full expenses of the business (one of the primary reasons why companies raise funding from venture capital firms). The key is to ensure that burn is prudent and efficient.
In general, if you are earning an incremental dollar of total Net New ARR for each dollar of cash burn you are in a strong position with a Burn Ratio of 1, indicating a healthy ratio relative to benchmarks. A Burn Ratio greater than 1.5x is best in class and below 0.6x Net New ARR to burn indicates that a closer look is warranted. We view cash burn efficiency as an effective shorthand metric to keep a watchful eye on – if it requires more than $2 of burn to generate $1 of revenues it may be a signal that growth is being “forced” and is therefore unsustainable.
2] Incremental Profit Margin

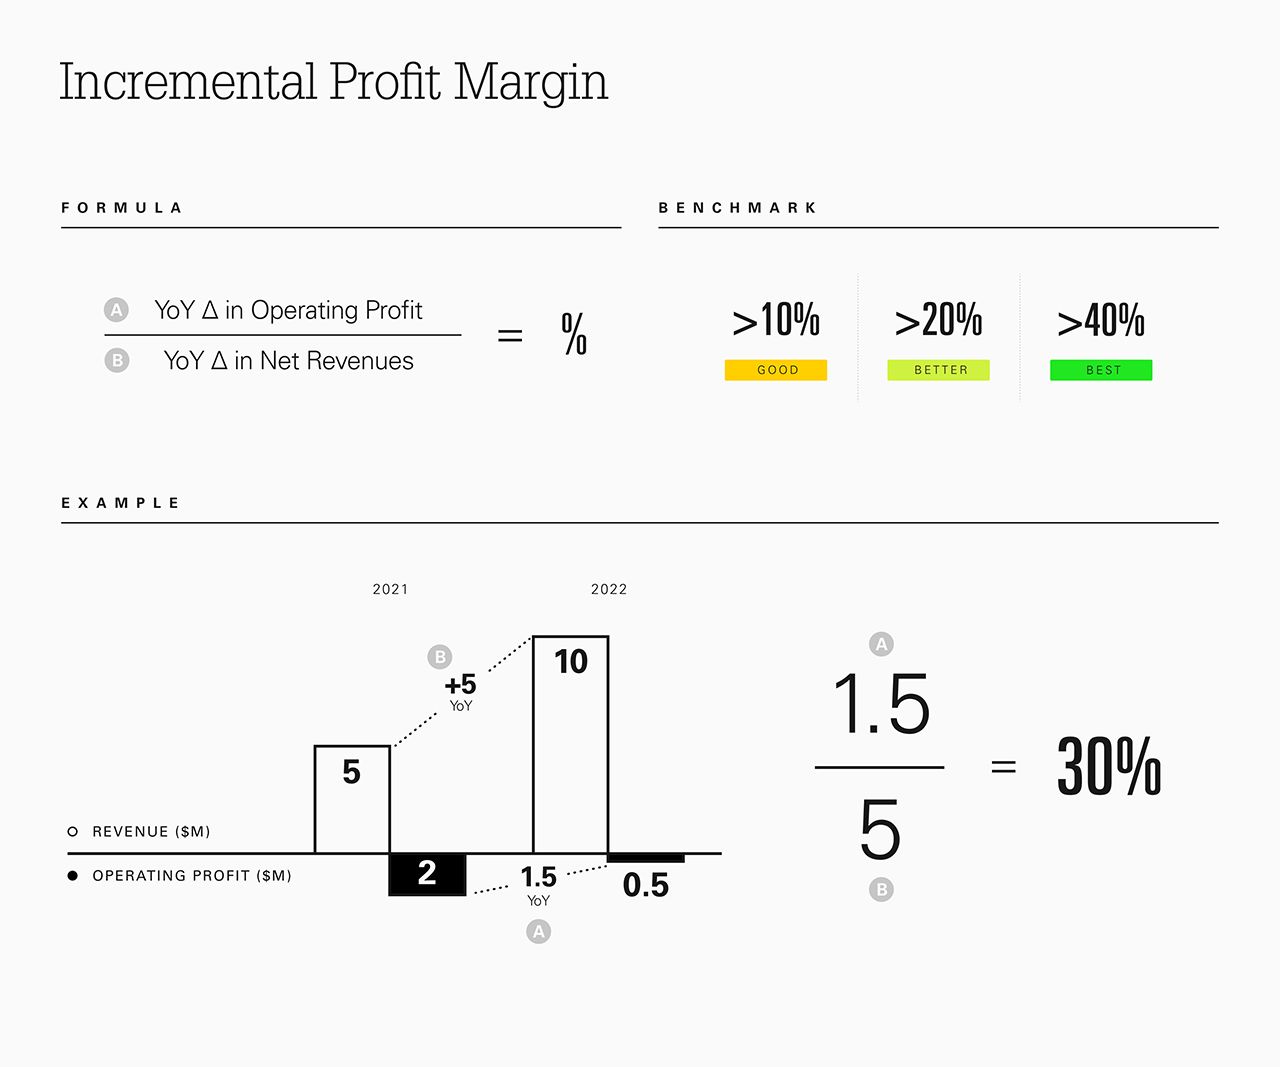
Often profitability is discussed in absolute terms but it’s important to keep in mind that companies typically show a progression towards profitability over time. That progression can either be smooth, indicating a strong underlying economic core, or it can be more erratic, indicating that closer attention could be warranted.
One way to analyze whether progression towards profitability looks healthy is to analyze the Incremental Profit Margin from one period to the next. Incremental Profit Margin is a great way to assess at what rate revenues are converting to Operating Profit. Anything at or above 40% is best in class from an Incremental Profit Margin perspective and anything at or above 20% is beginning to look healthy. It’s worth taking a very close look at your cost structure if your Incremental Profit Margin is trending at 10% or lower. Over time, Incremental Profit Margin should theoretically converge to Gross Margin less any other variable costs (e.g., customer acquisition).
3] Pre-S&M Profit Margin

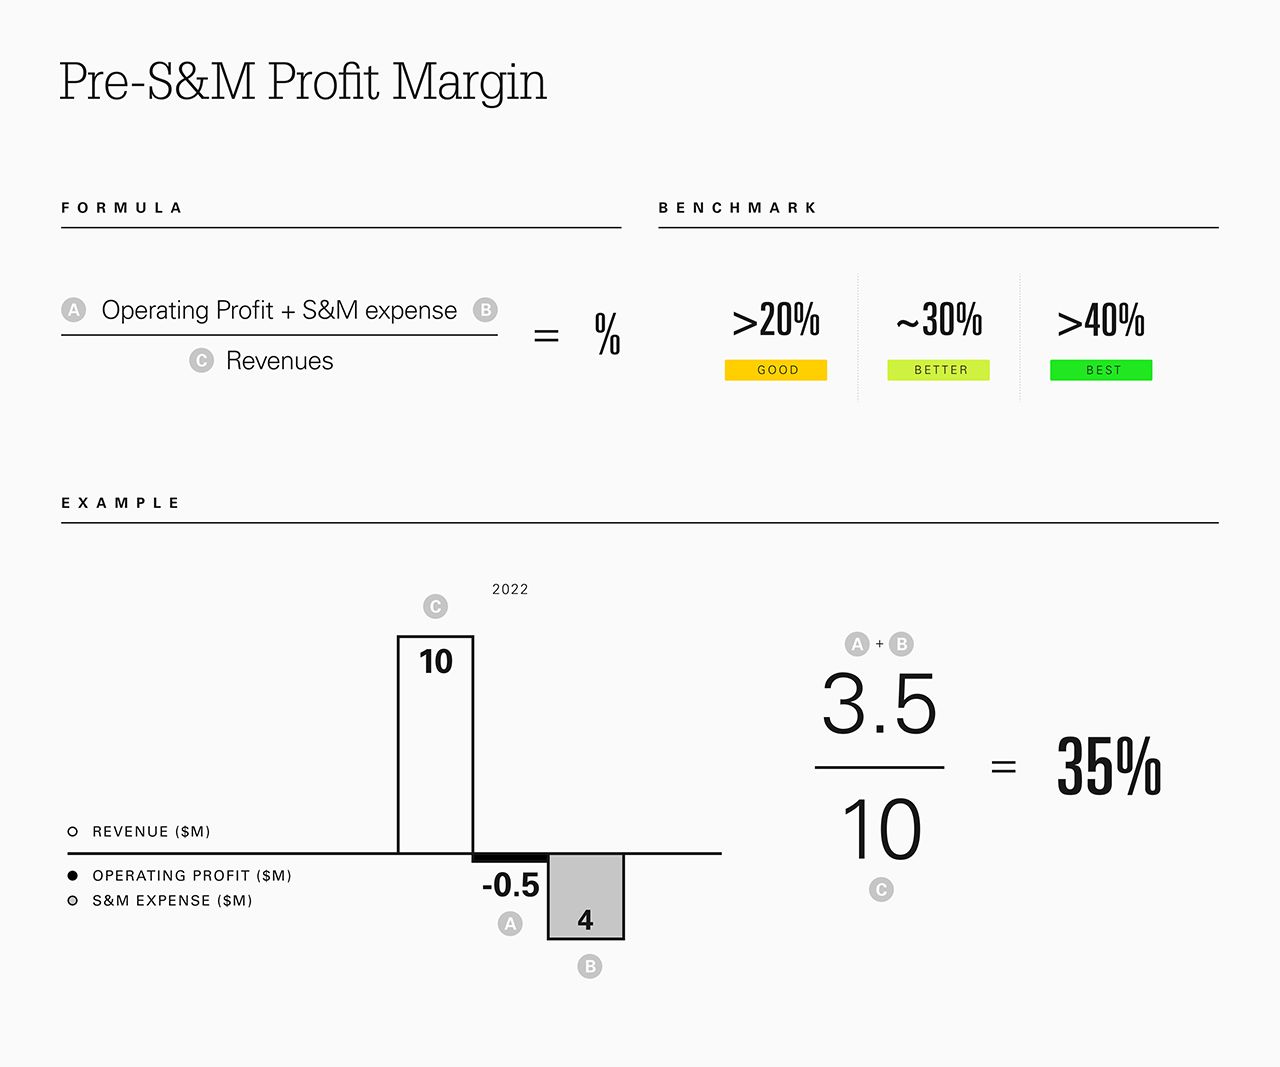
Technology companies typically group Operating Expenses into three categories: Sales & Marketing (S&M), Research & Development (R&D), and General & Administrative (G&A). If you have a highly retentive product, S&M could be considered an investment in future growth and a variable expense as opposed to a fixed expense. R&D and G&A are typically considered more fixed in nature and related to maintaining your current revenue base and customer relationships.
Given that S&M is an investment today for future growth, one helpful metric to analyze cost structure is Pre-S&M Profit, which takes Operating Profit Margin and adds back Sales & Marketing Expense. This tells you how much margin you have before making the decision to invest in Sales & Marketing. A Pre-S&M Profit Margin of approximately 20% or higher can be considered quite healthy because it means your company has adequate budget to invest in S&M. 40% or higher would be considered best in class. Similar to the Incremental Margin analysis, more important than the absolute number is looking at the trajectory over time to ensure a healthy progression.
Keep in mind, there’s tremendous nuance when evaluating cost structure and always exceptions that break benchmarks. Additionally, these are not the only profitability-focused metrics which warrant tracking. We’ve also found metrics like Magic Number, LTV to CAC, and Rule of 40 to be helpful financial indicators. In strong macroeconomic times these metrics can go overlooked and underappreciated, but they are now important as capital efficiency has returned as a critical strategic priority for nearly all companies.
Which profitability-focused metrics do you track closely? Write to us @IndexVentures – we’re excited to hear from you!
THIS PIECE WAS ORIGINALLY PUBLISHED IN TECHCRUNCH.
Published — Jan. 23, 2023

